AtaGenix Laboratories
AtaGenix Laboratories
Release time: 2024-11-05 View volume: 99

Figure 1: Schematic of Antibody Coding Gene Structure (including 5’ and 3’ untranslated regions)

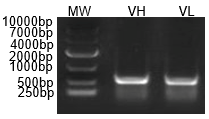
Figure 2: PCR Amplification of Heavy and Light Chain Variable Regions

Figure 3: Colony PCR Validation Gel
M: DL10000 DNA Marker; 1% Agarose Gel
| Sequence | V-GENE and Allele | Functionality | V-REGION Identity (%) | J-GENE and Allele | D-GENE and Allele | AA Junction | Junction Frame |
|---|---|---|---|---|---|---|---|
| VH | Musmus IGHV1-71-16*01 F | Productive | 96.53% | Musmus IGHJ4*01 F | Musmus IGHD2-4*01 F | CAITTGYAMDYW | In-frame |
| VL | Musmus IGKV4-74*01 F | Productive | 97.51% | Musmus IGKJ4*01 F | - | CHQYYRSPFTF | In-frame |

Figure 4: Antibody Heavy and Light Chain Sequence Analysis

Figure 5: Antibody Heavy and Light Chain Sequencing Peak Map
Contact Us
+86-27-87001869
info@atagenix.com
Building C, R & D Building, No. 666, Shendun 4th Road, Donghu New Technology Development Zone, Wuhan

